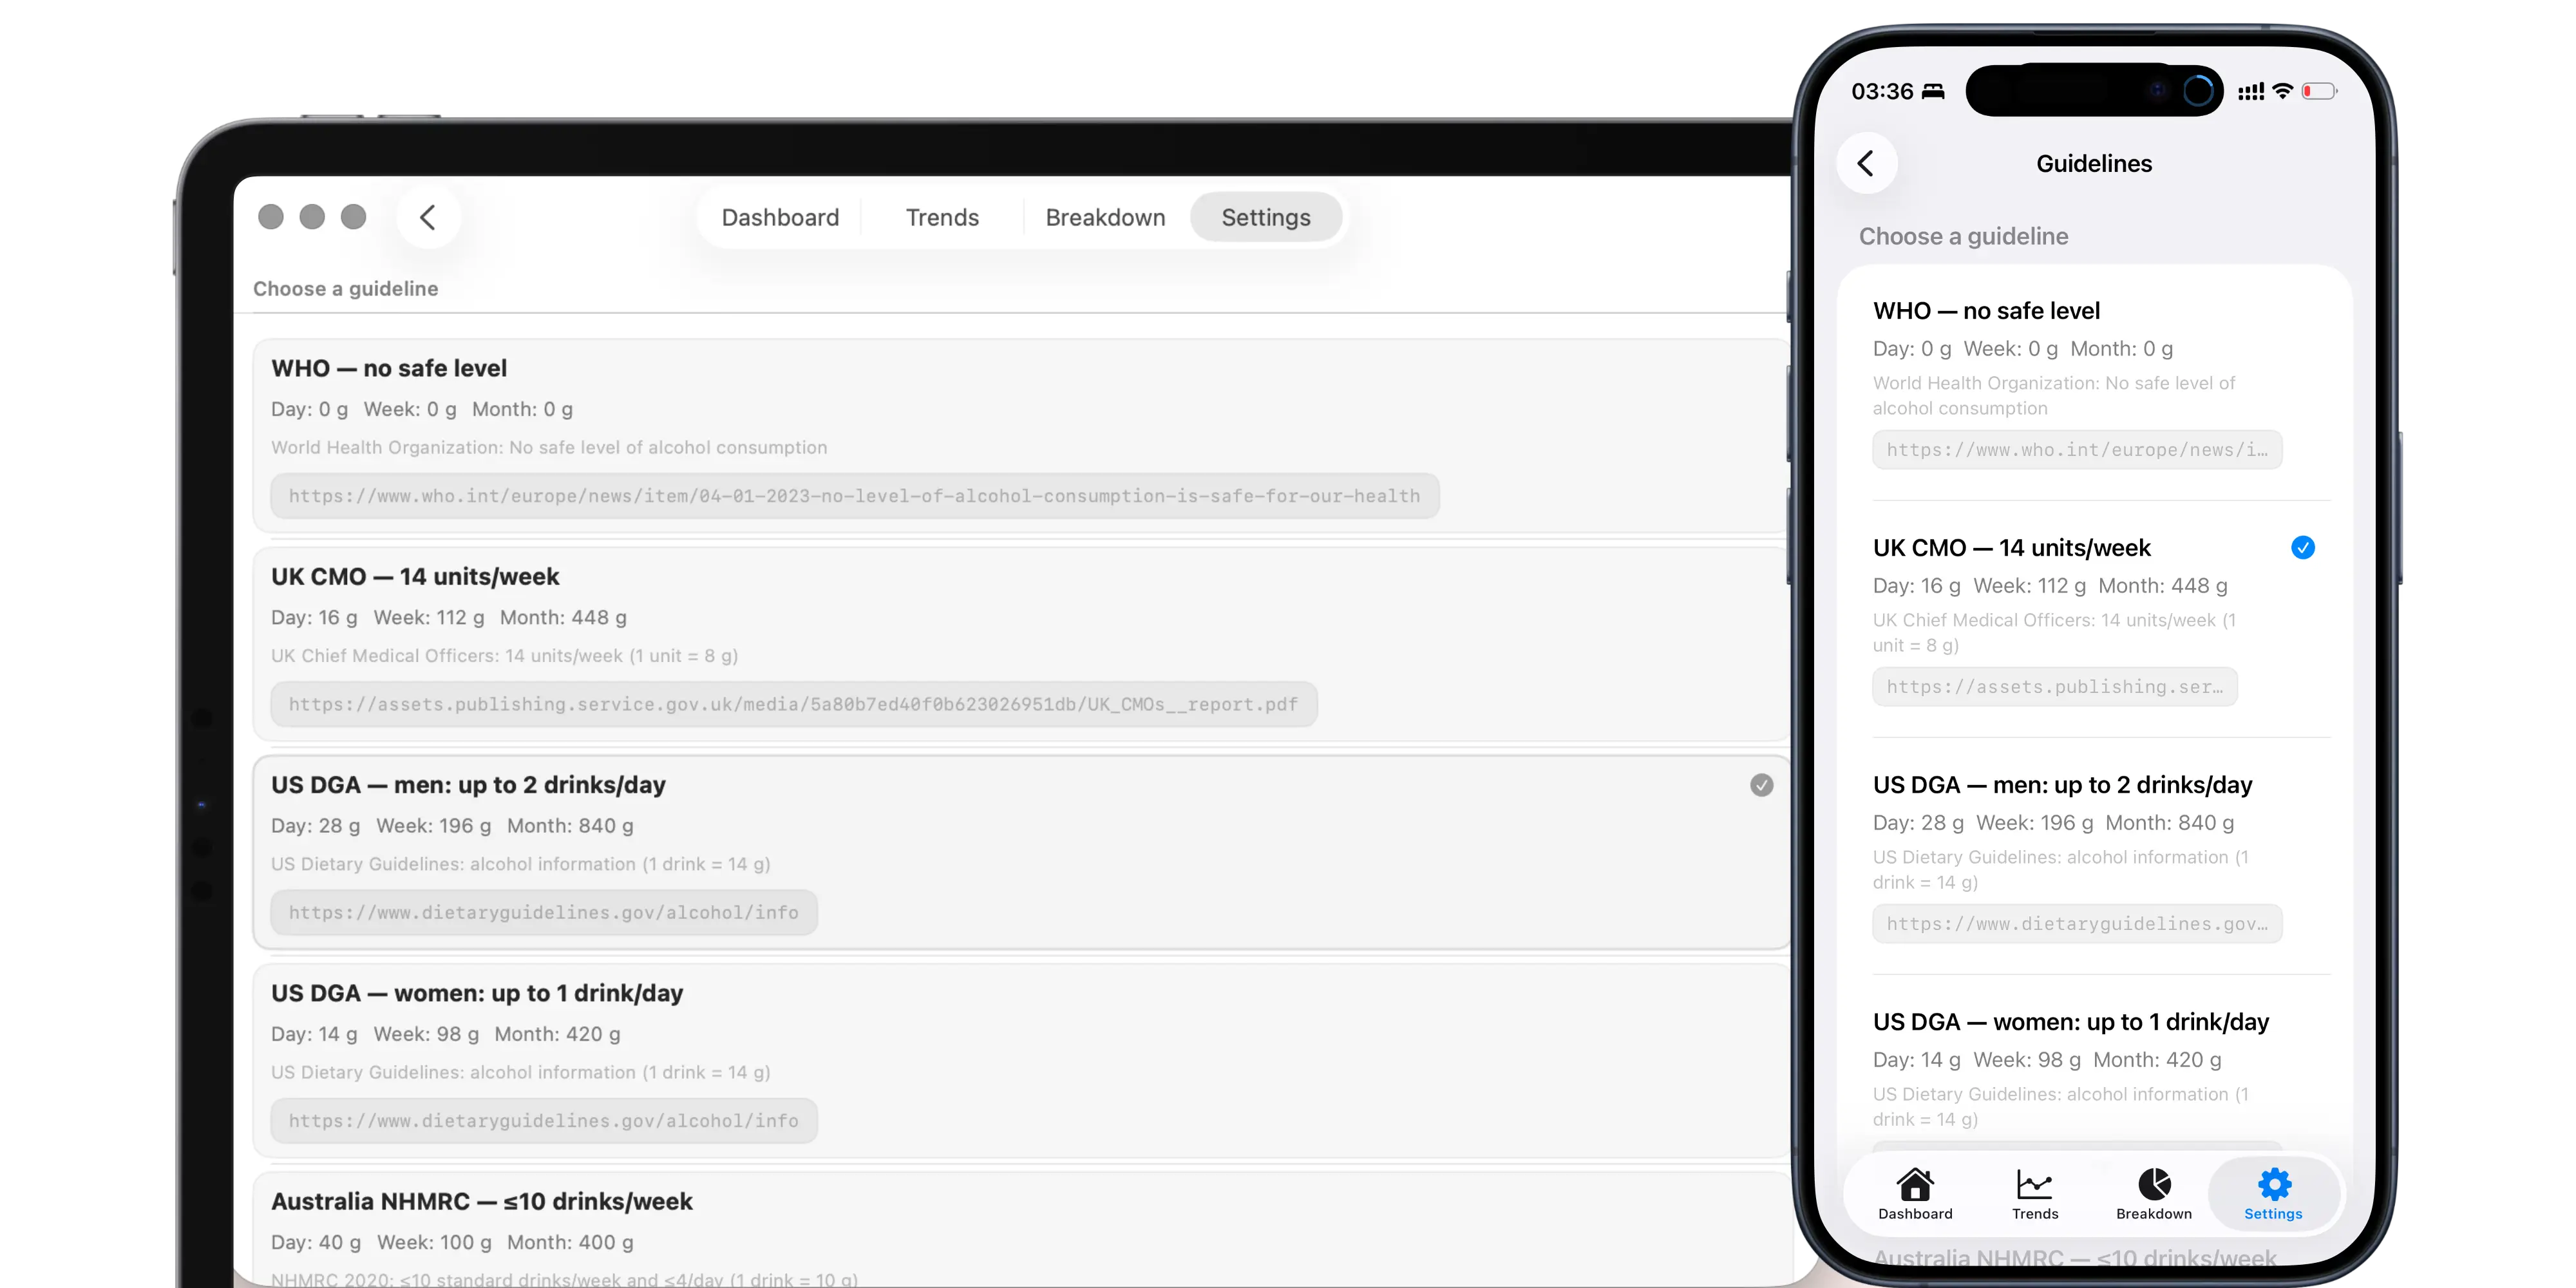
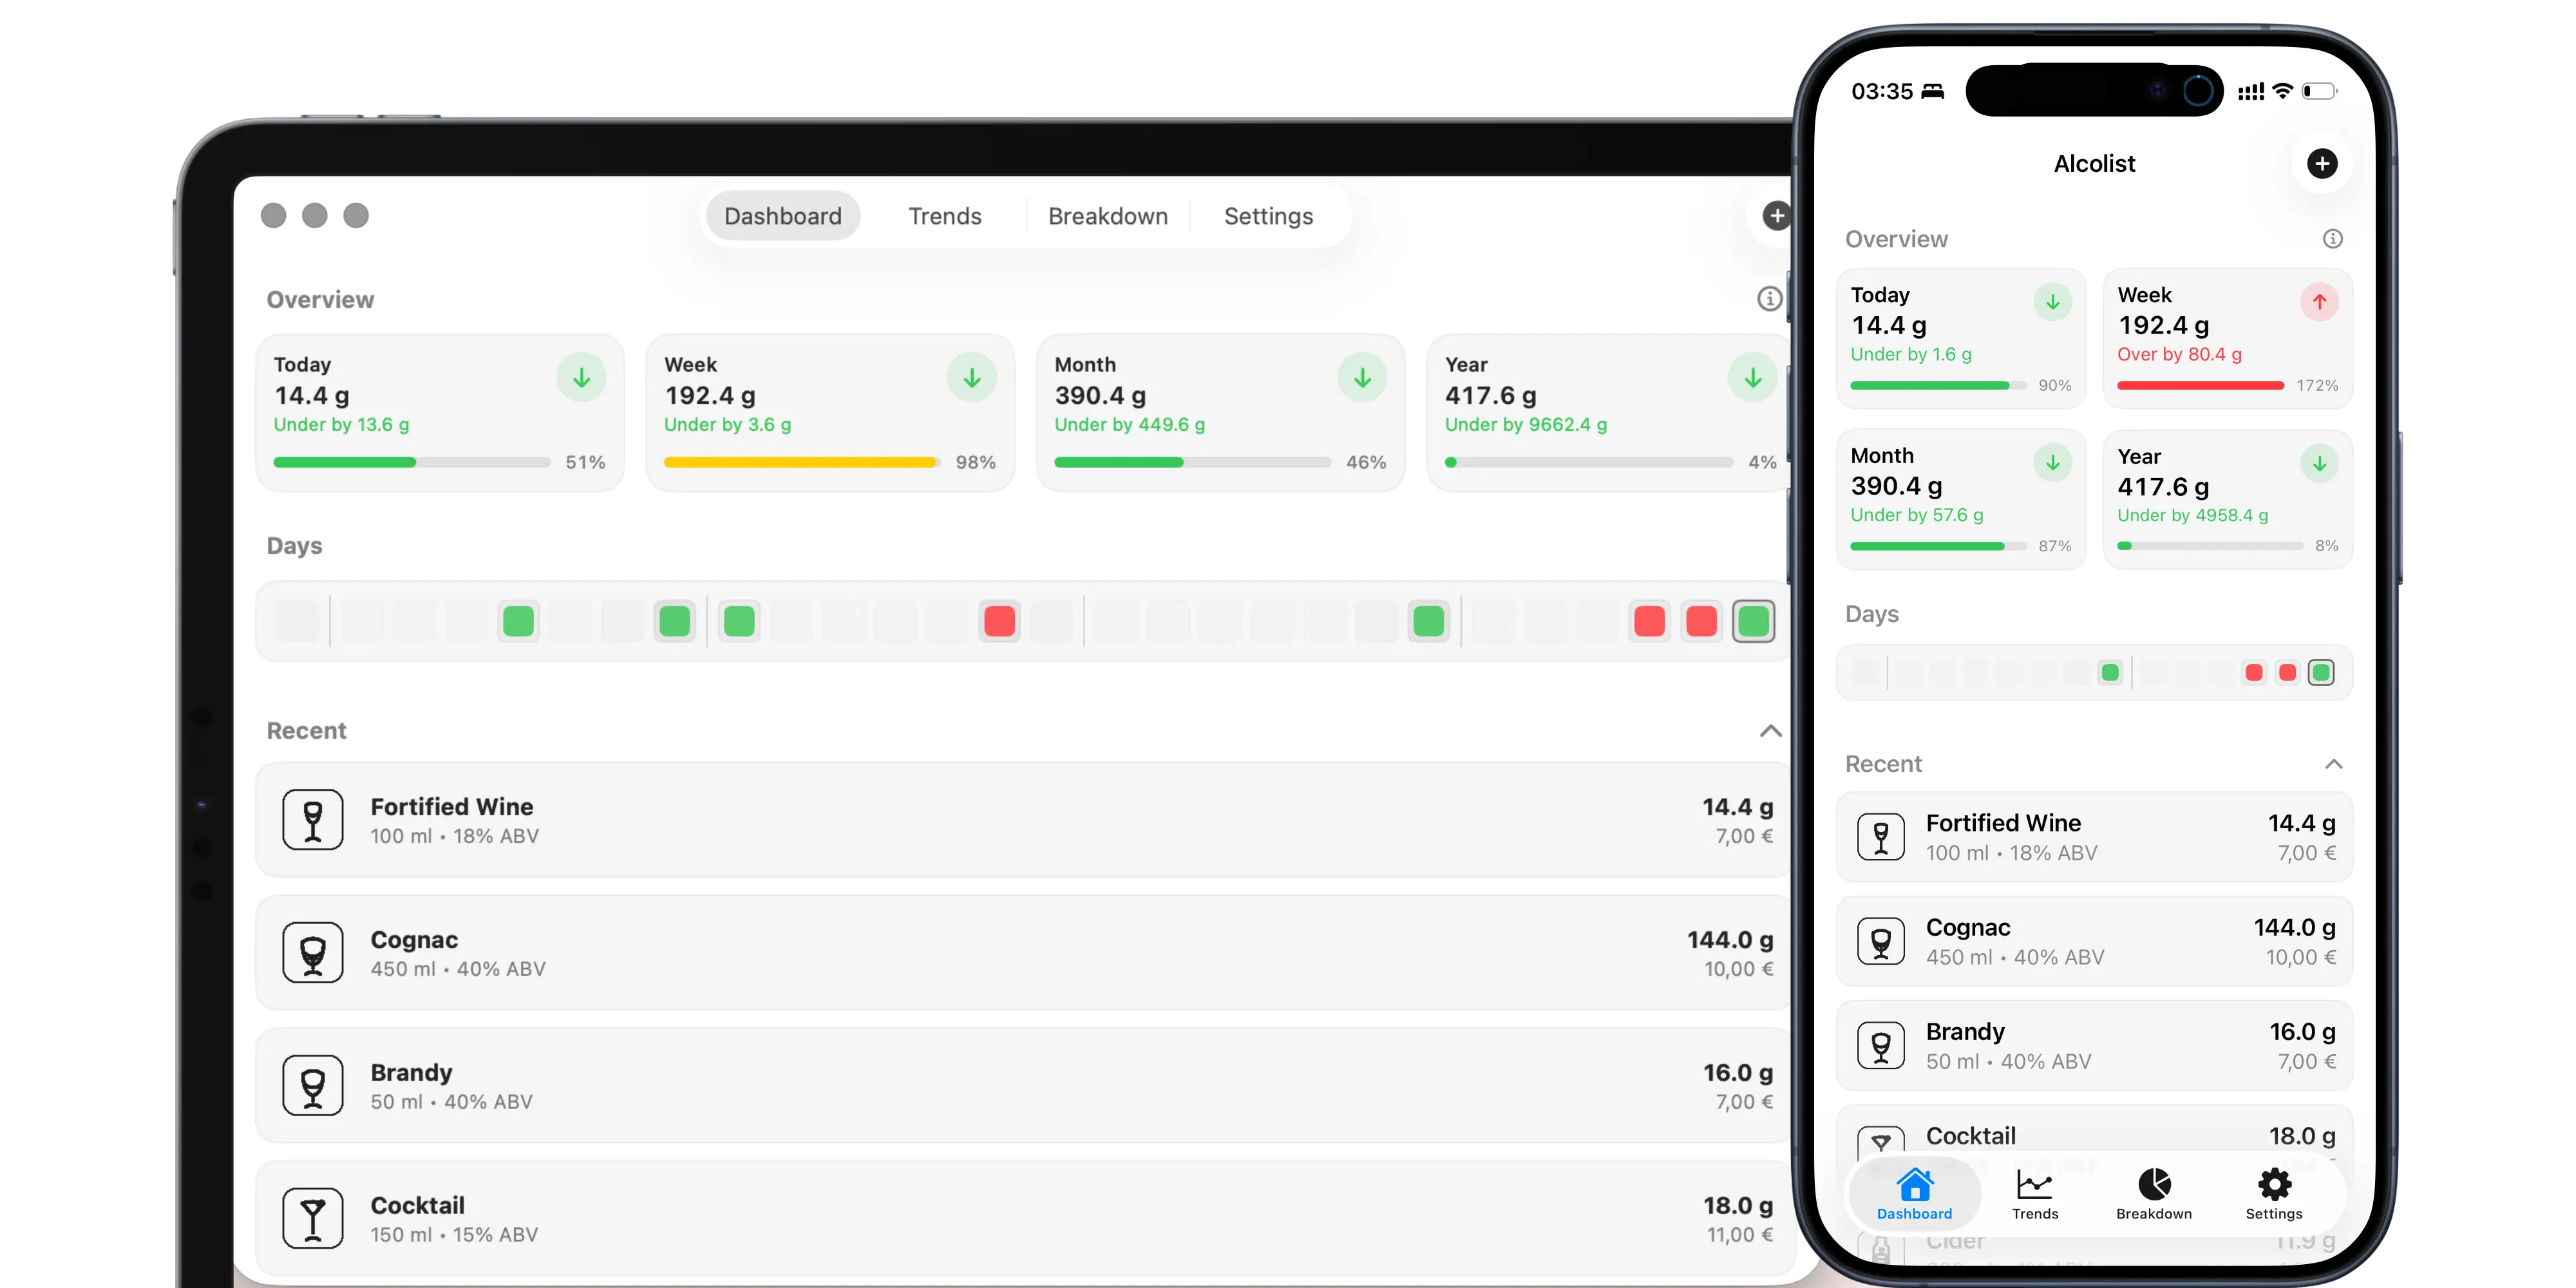
Dashboard totals at a glance
See Today / Week / Month / Year totals instantly, with a clear under / near / over status based on your selected guideline.
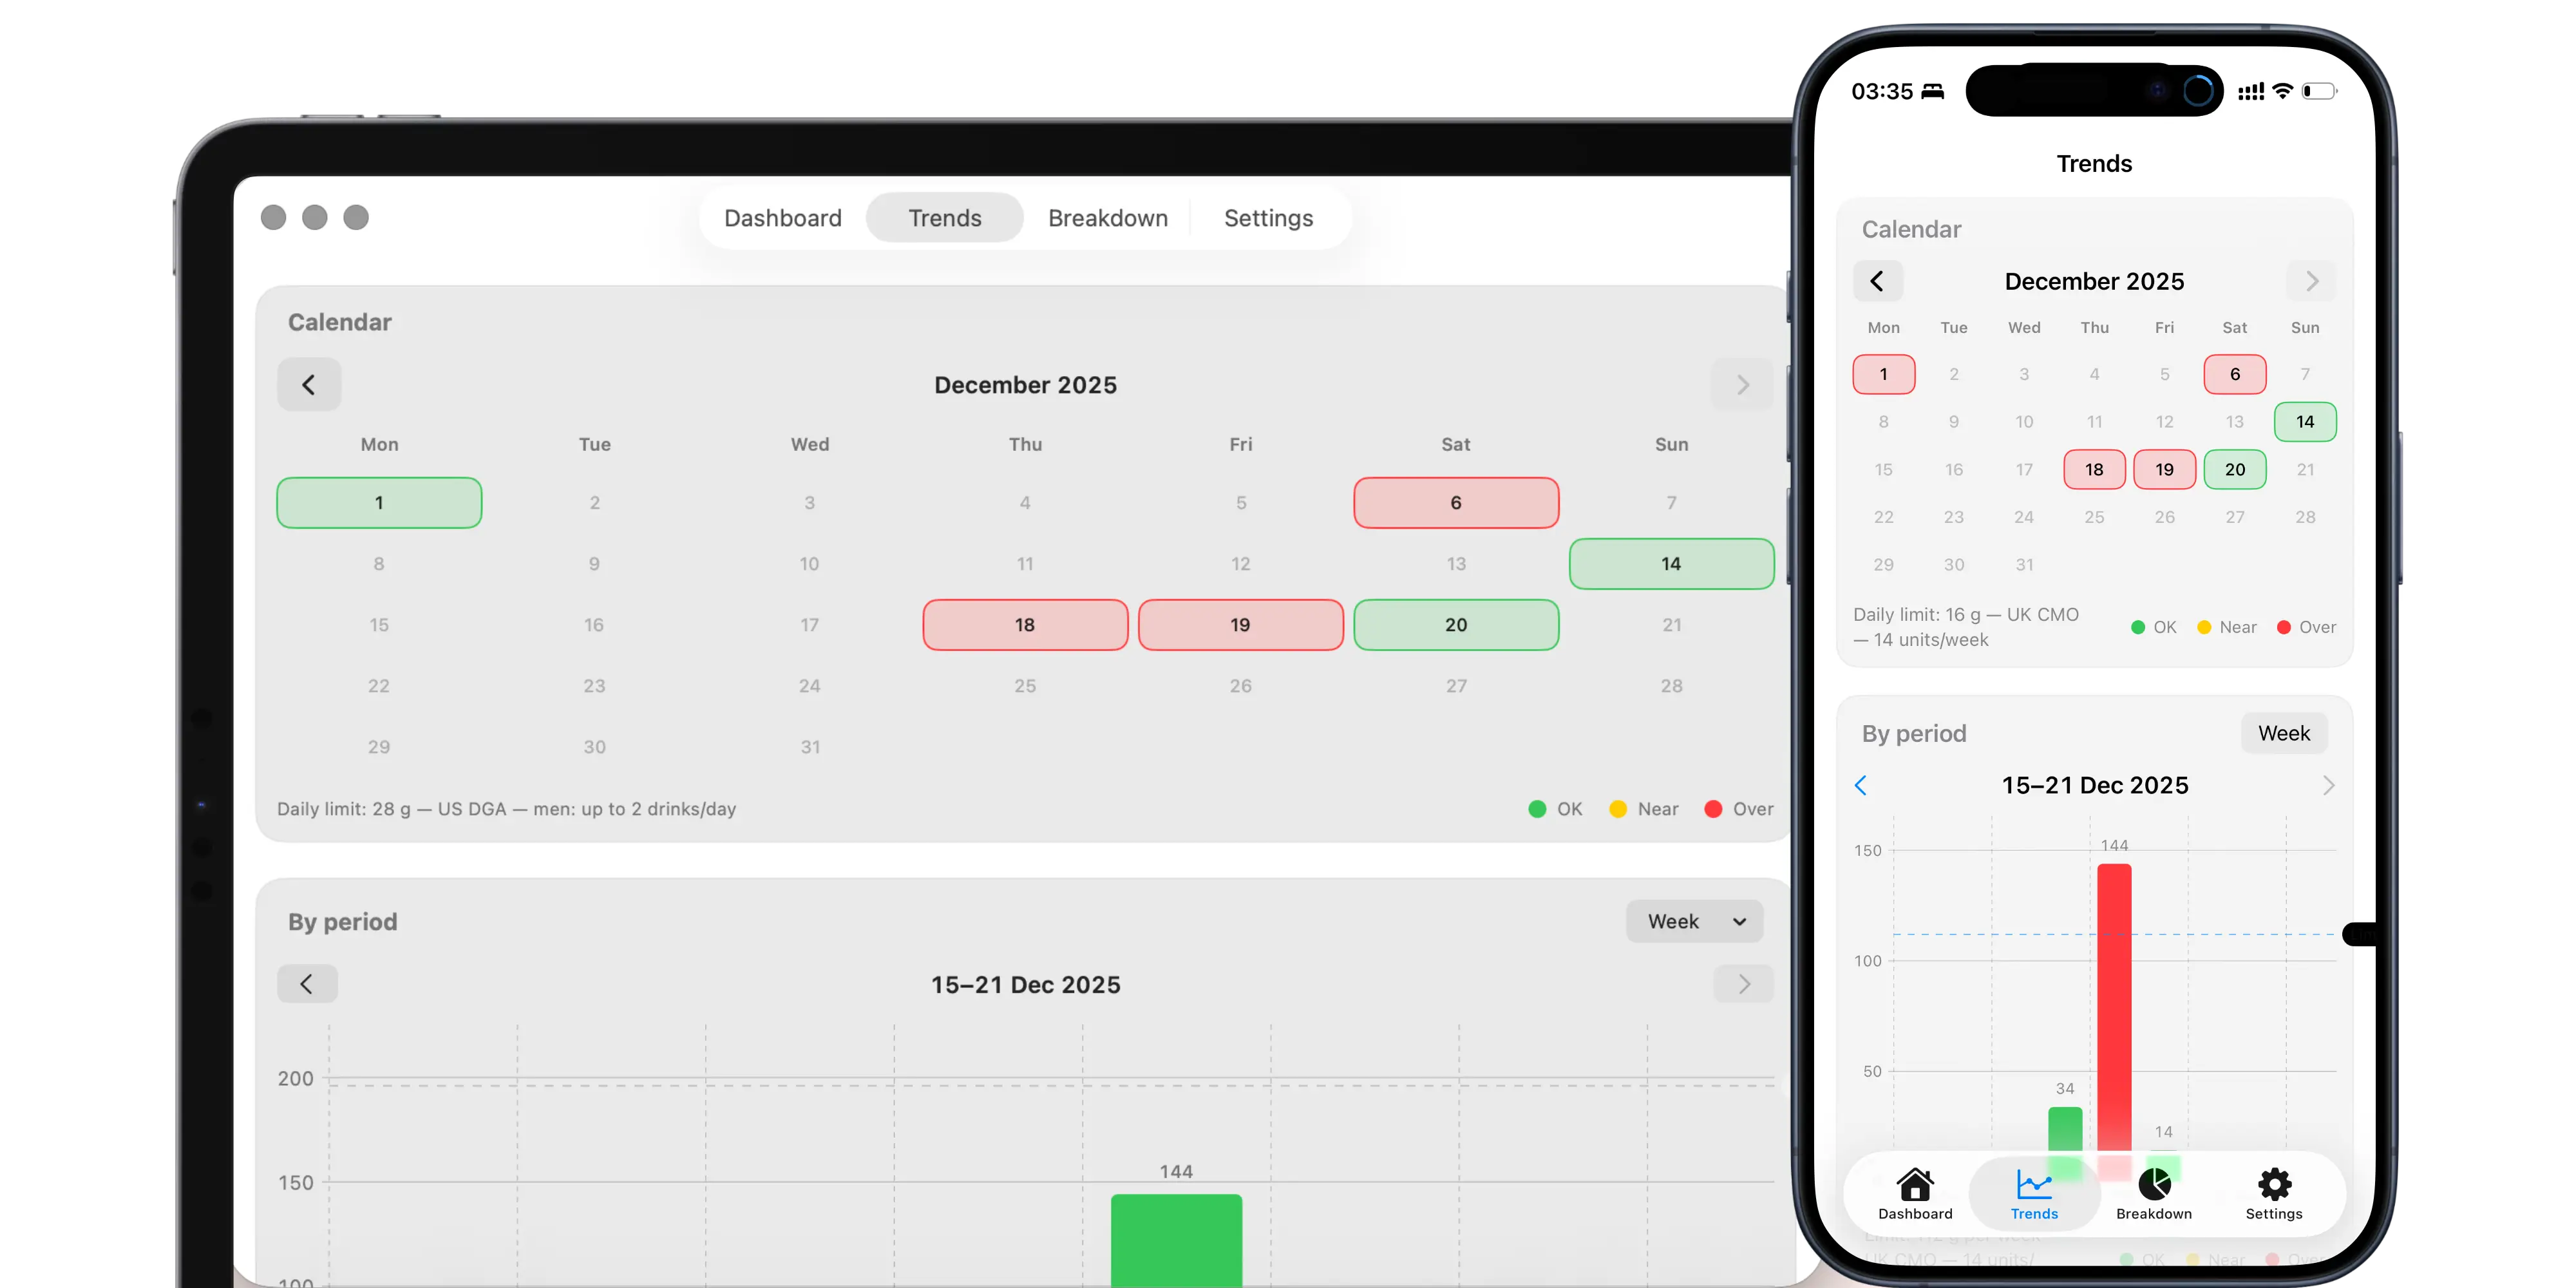
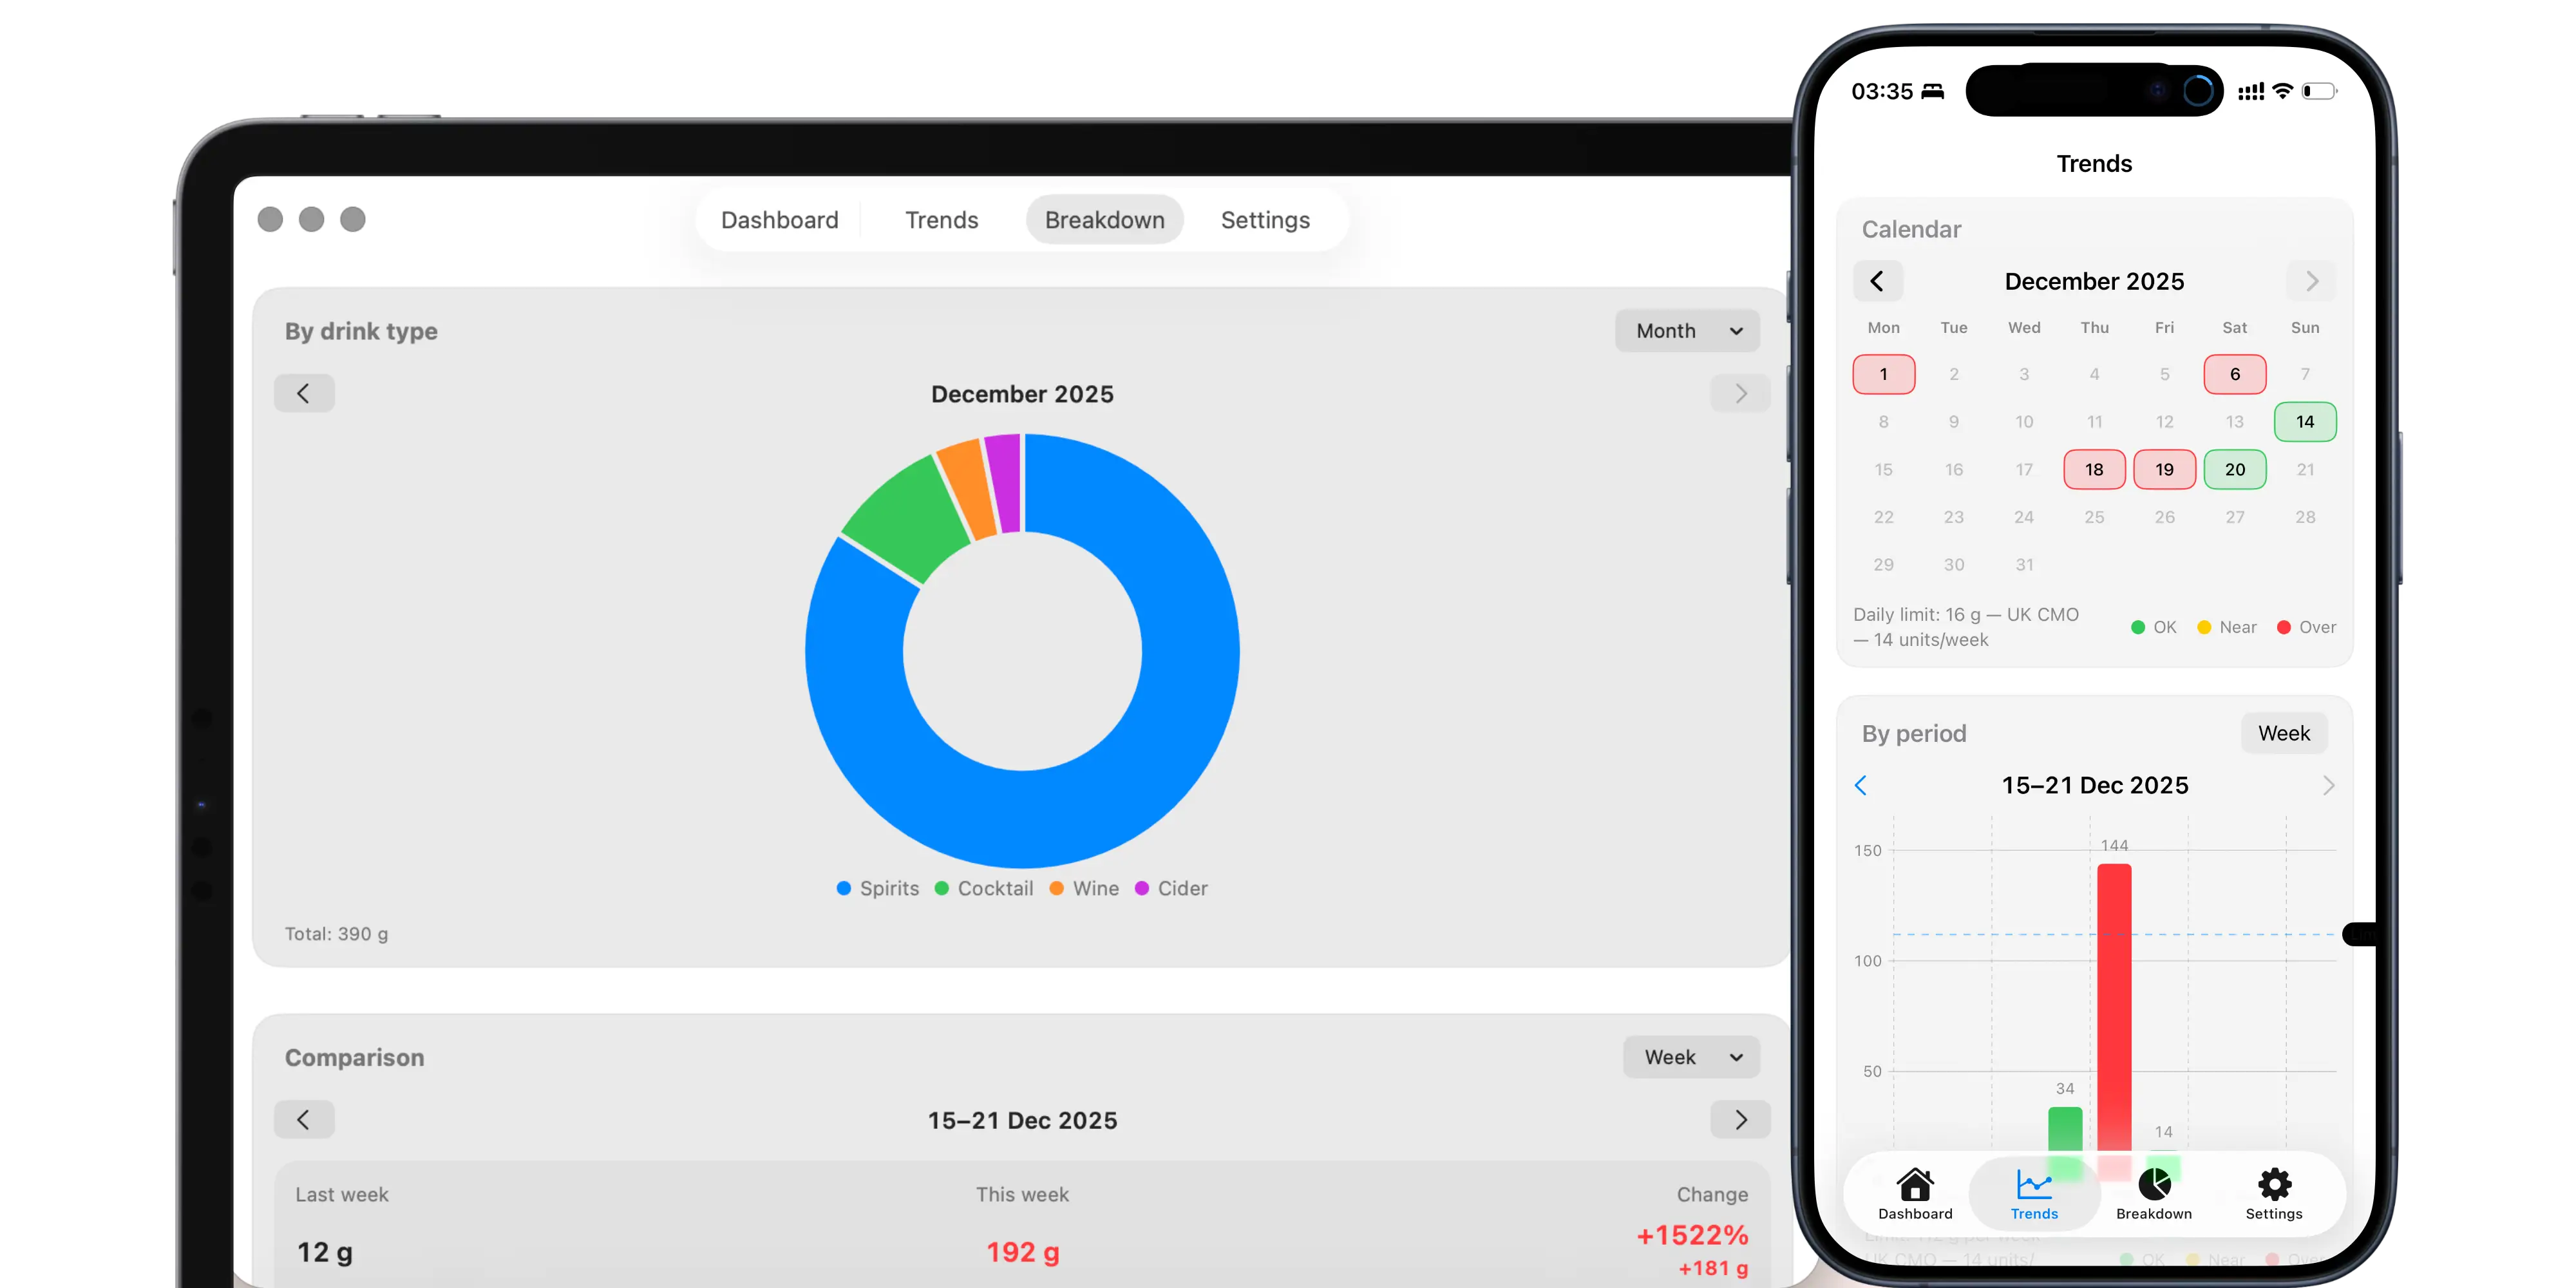
Calendar that highlights your days
A monthly calendar makes it easy to spot drinking days and quickly open the details for any date.
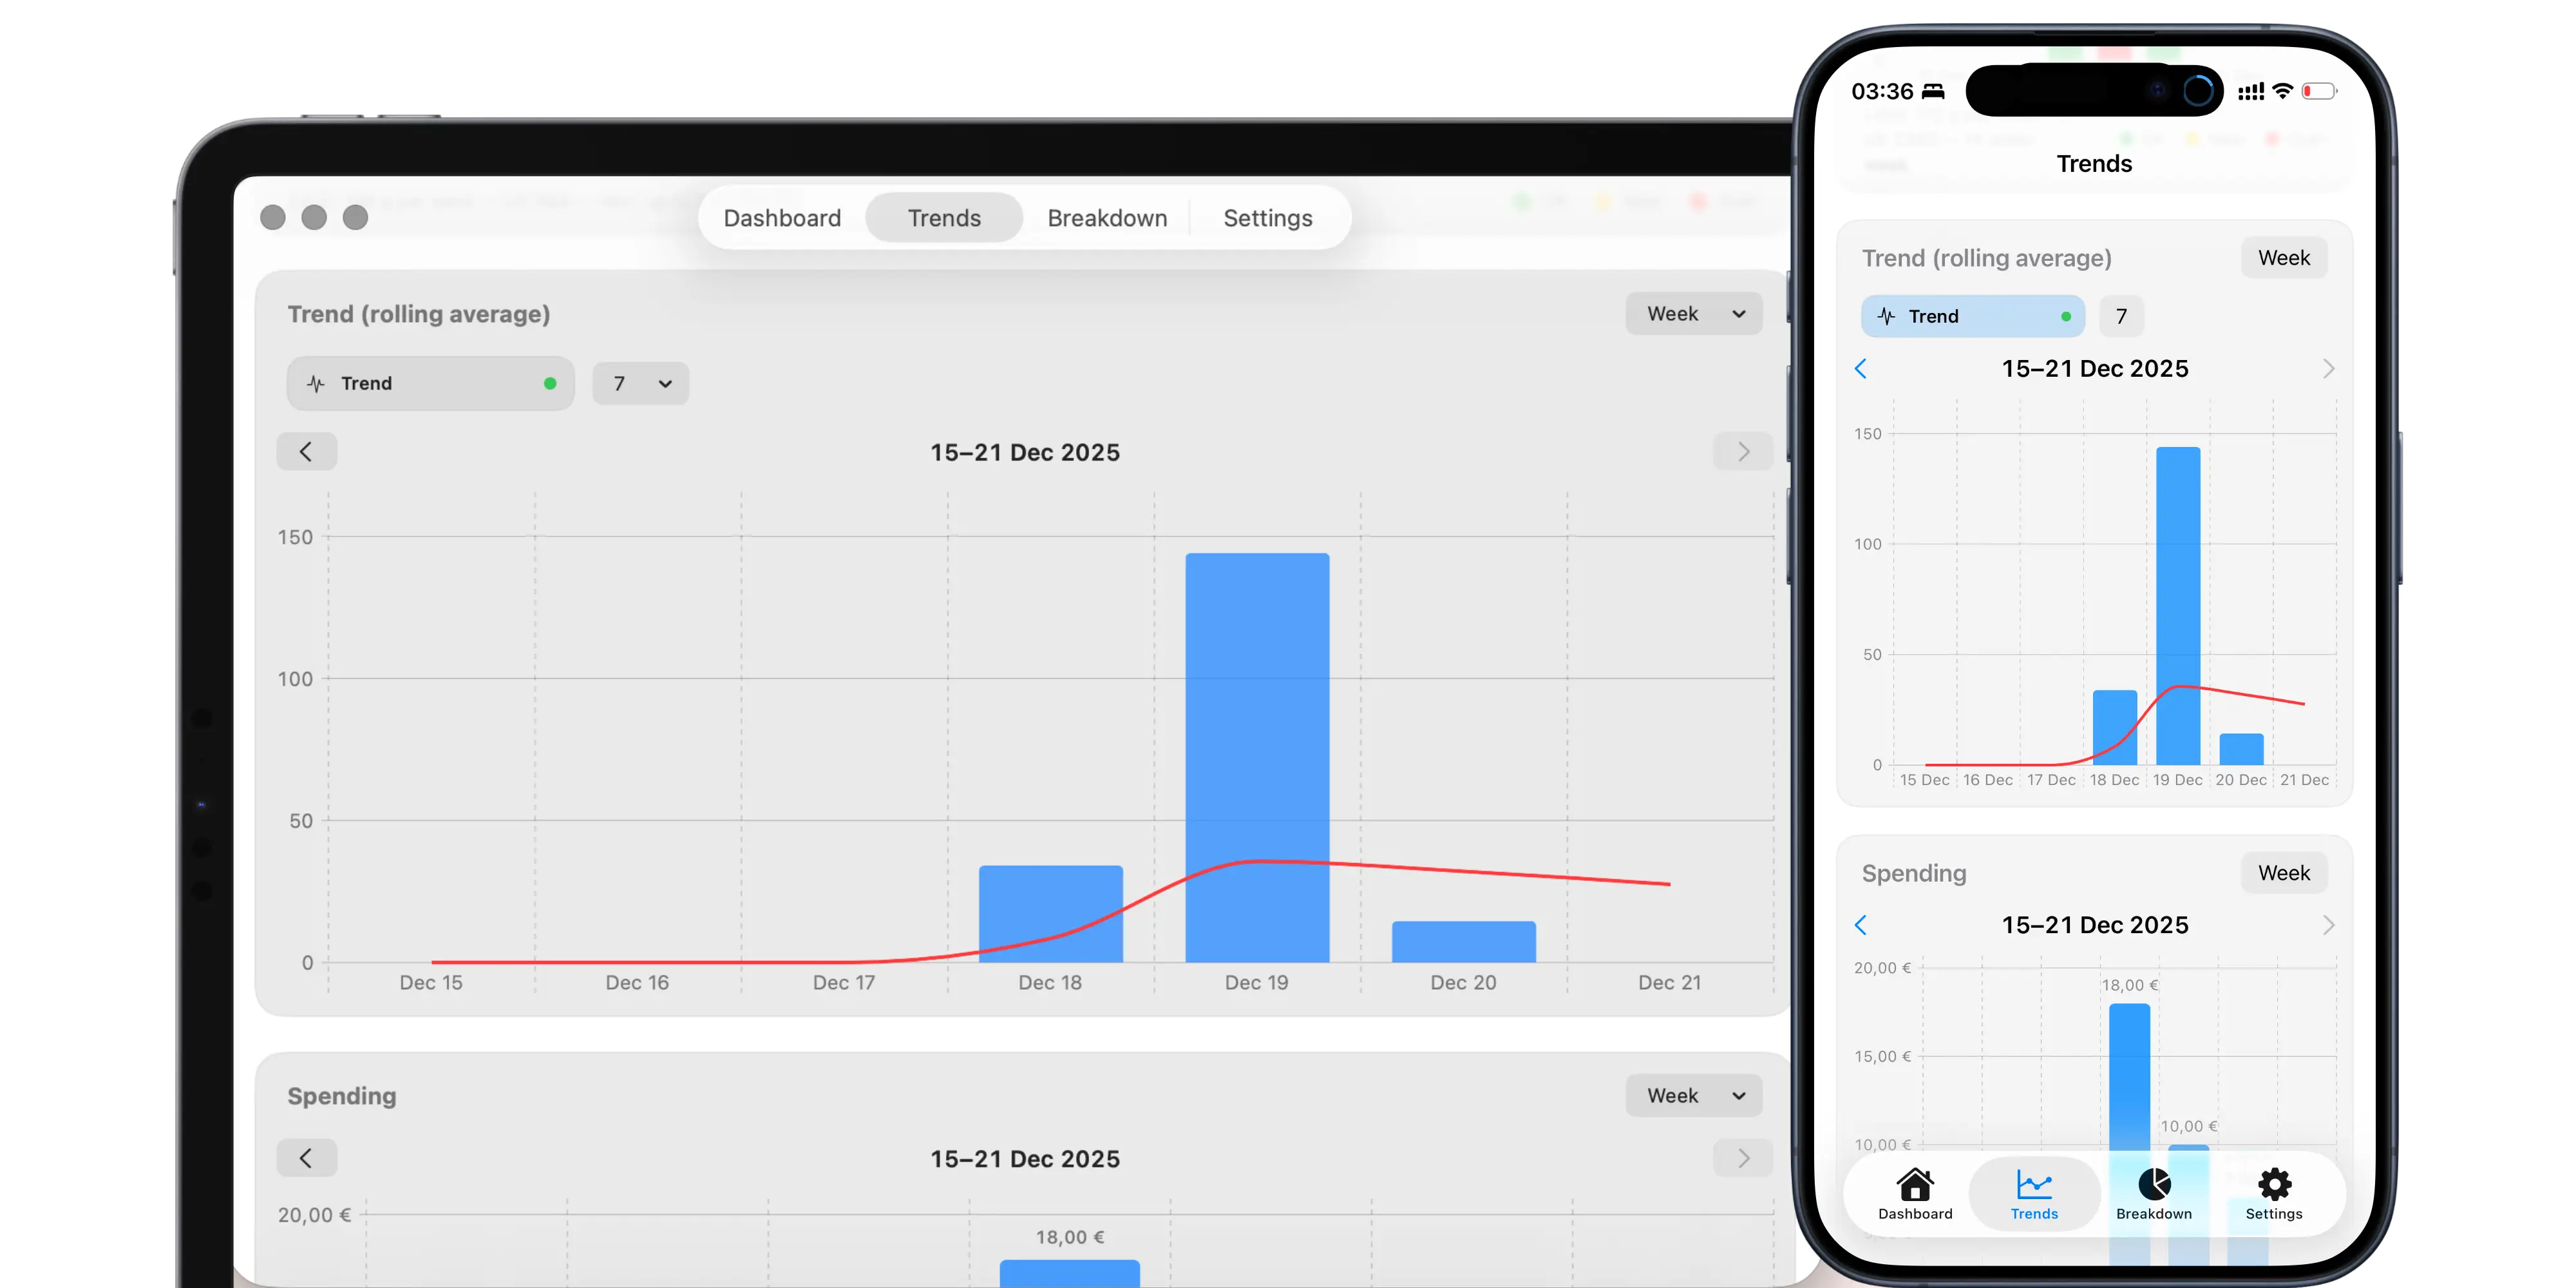
Trends with rolling average
Watch the direction of your habits—not just isolated days—with a rolling average trendline that reveals change early.
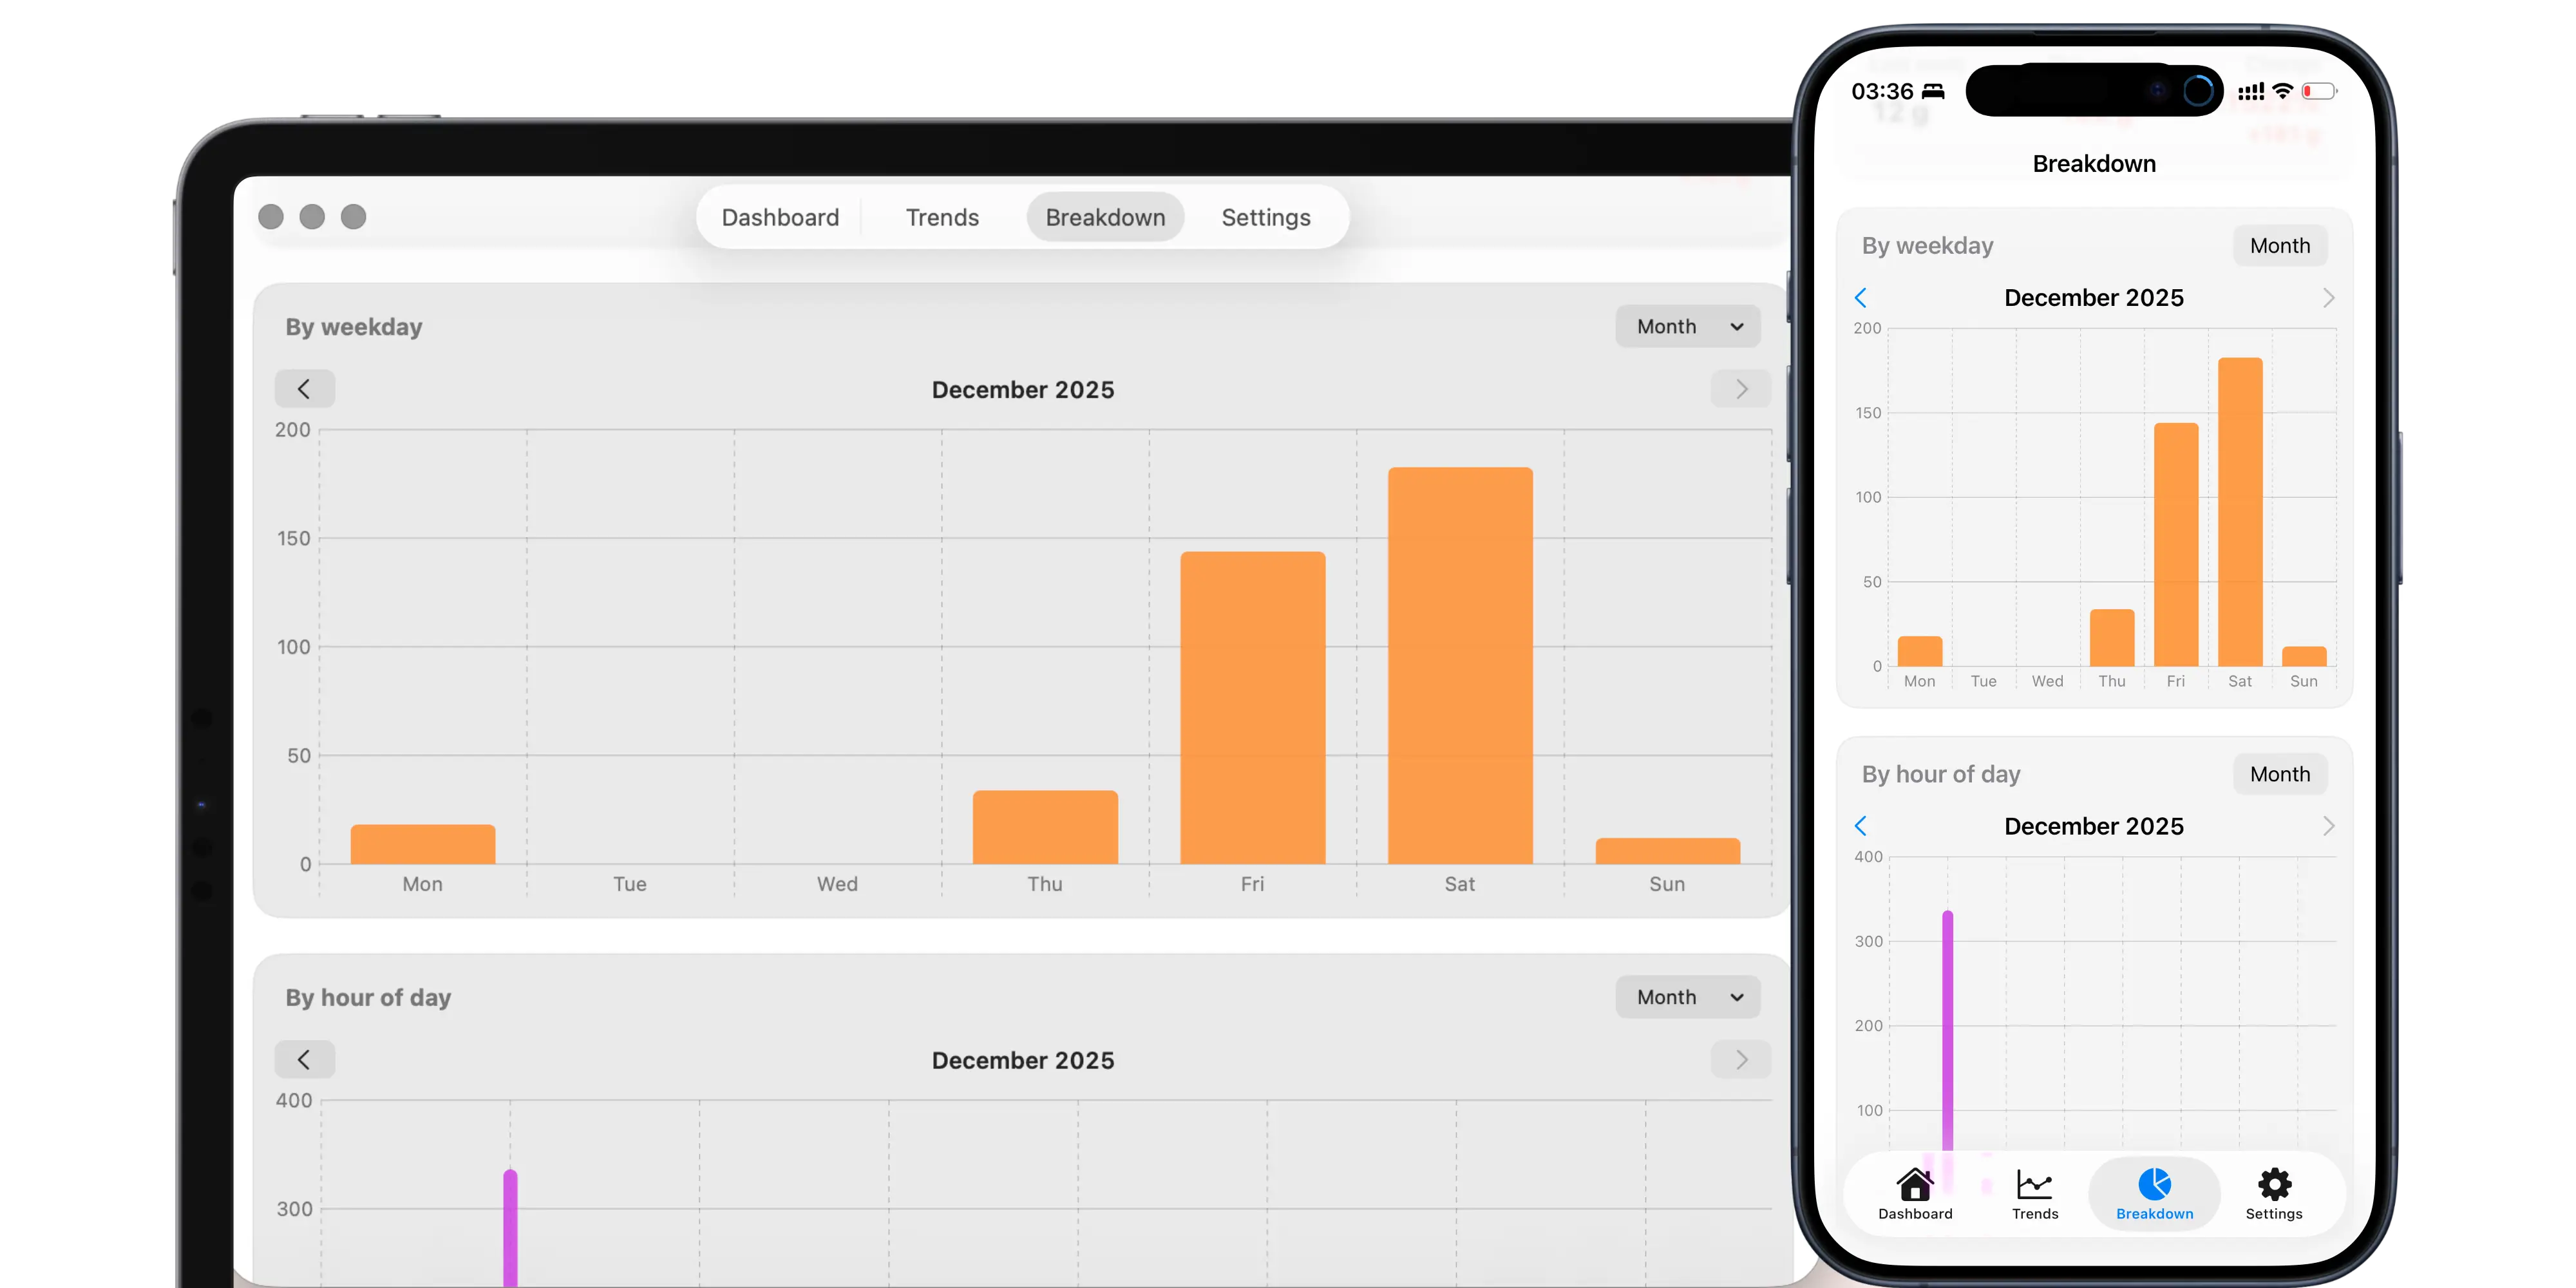
Breakdowns that reveal patterns
See what contributes most: drink type distribution, weekday patterns, and time-of-day habits—plus comparisons between periods.
Period charts that add up
Use weekly, monthly, and yearly views to understand how each period accumulates—and where spikes happen.
Track spending (optional)
Add prices to entries and see totals and averages over time—so you understand the cost of your drinking, too.
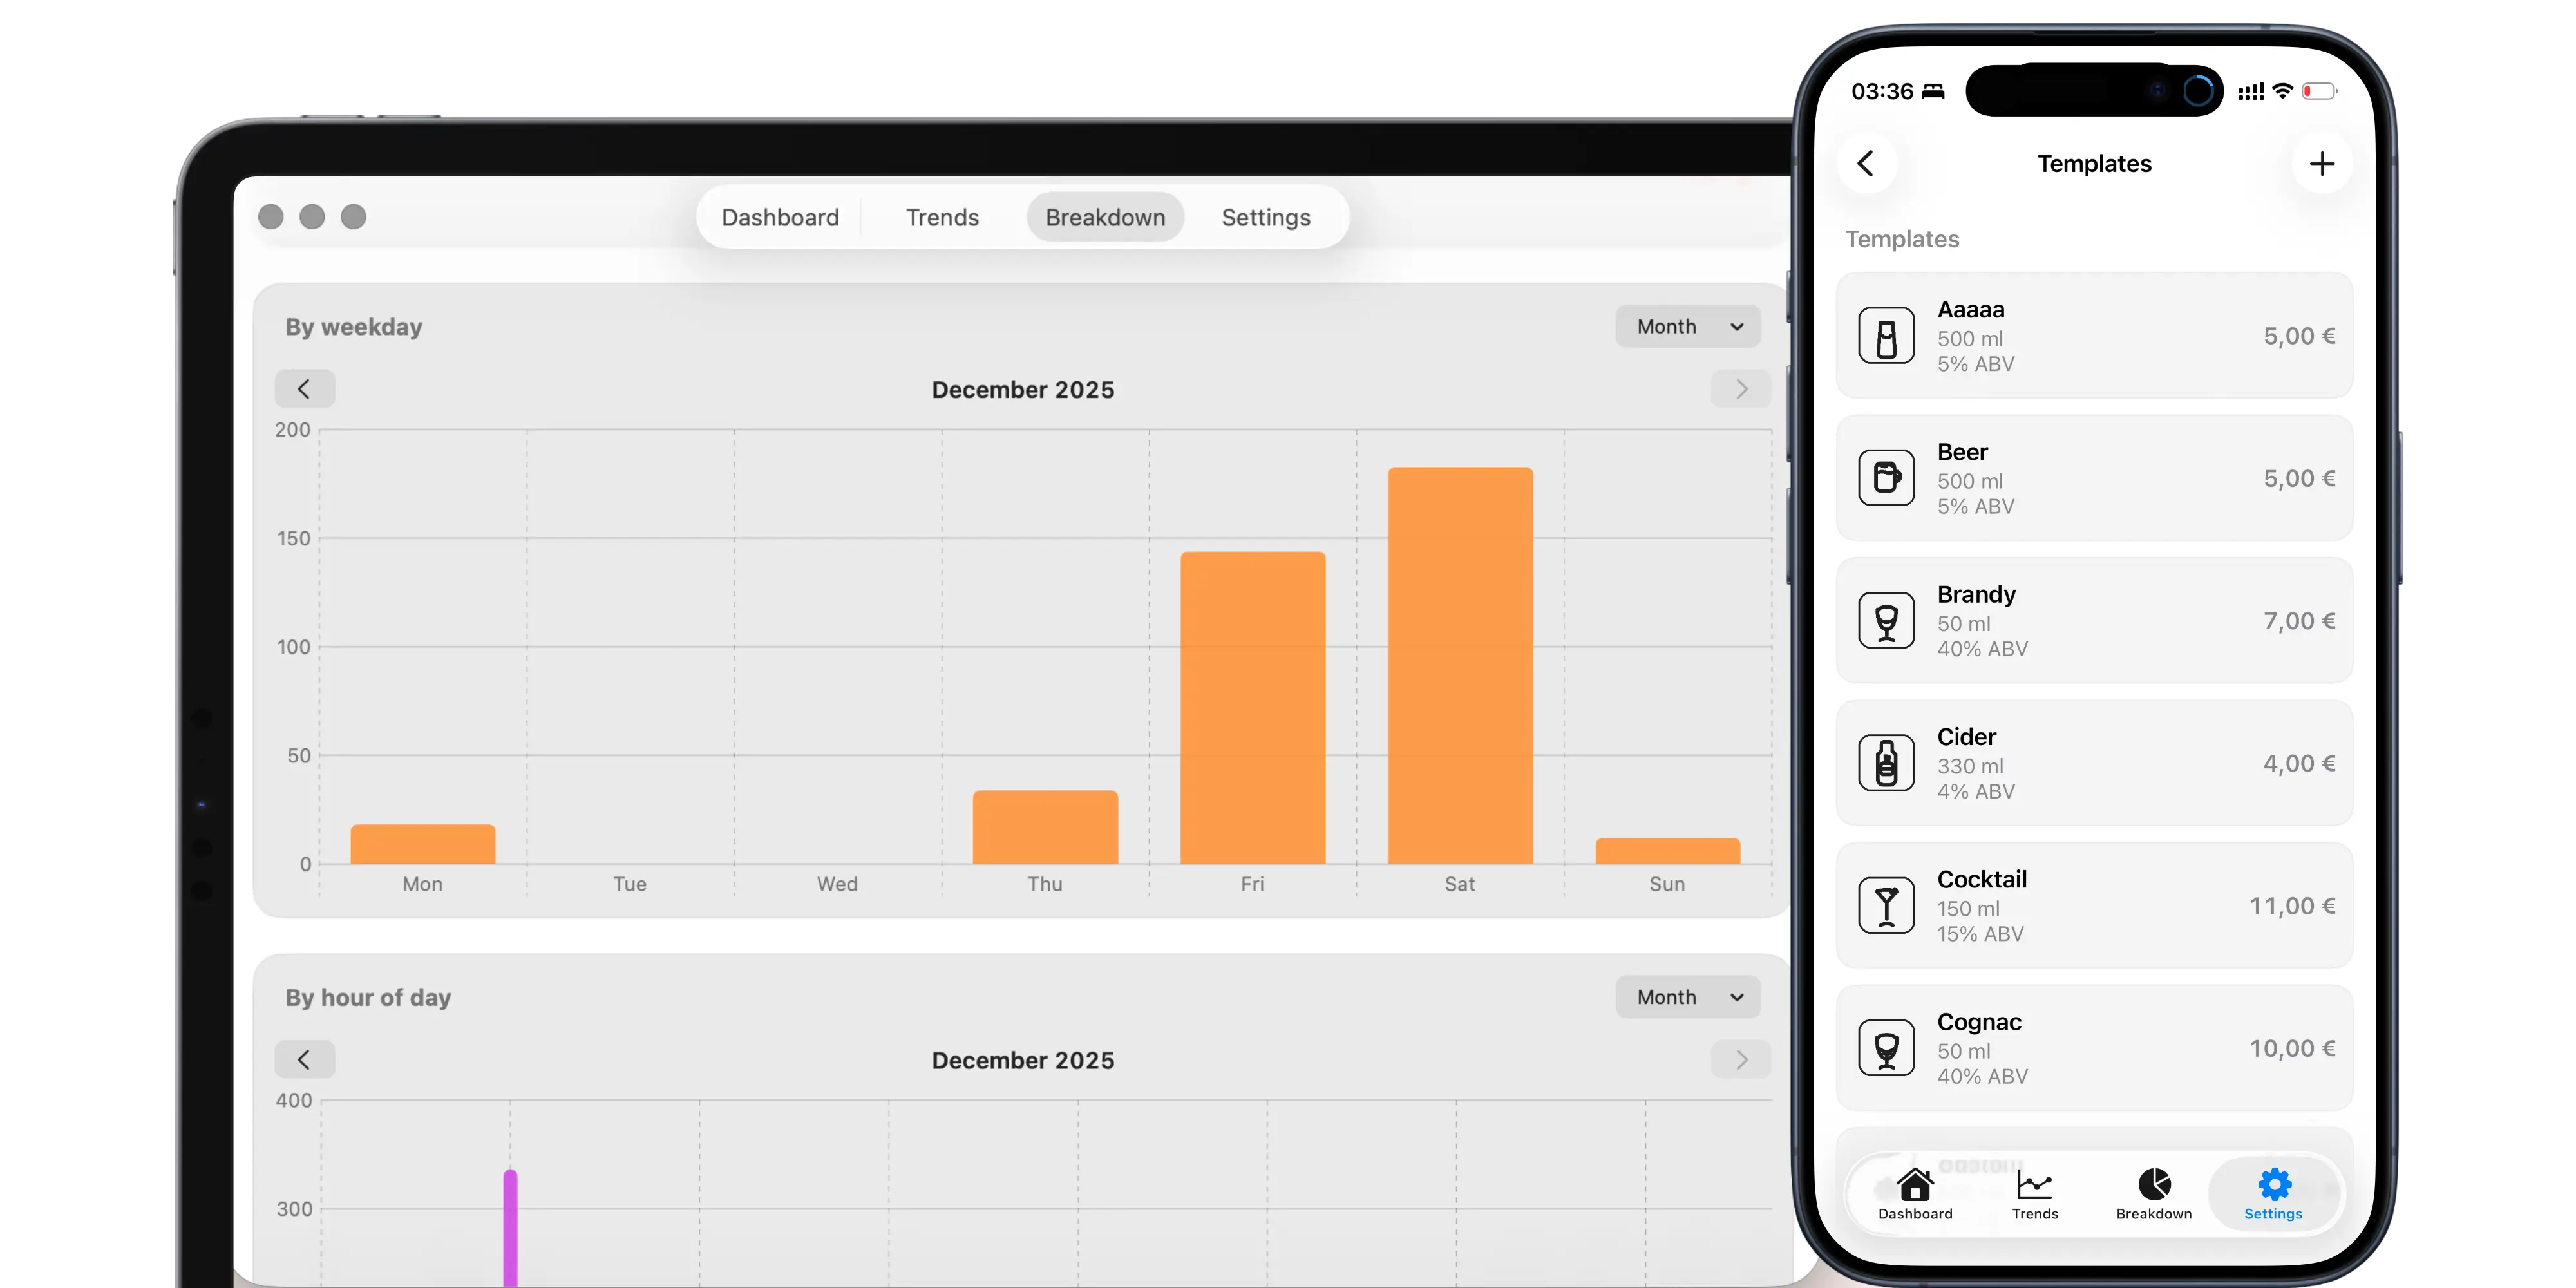
Templates for quick logging
Save your usual drinks once (volume, ABV, price) and add them again in one tap—fast, consistent, and effortless.
Export your data (CSV/JSON)
Export your drinking log for your own records anytime, with CSV/JSON options and flexible date ranges.